Sunday, January 23, 2011

Applications of Differentiation: Analysis of Functions

Let me tell you a story of a little boy riding a crazy wavy coaster.
From the start, at the peak, the boy started to move. He couldn't wait anymore. The cart started to move faster, and faster! and faster! The car slants and is most precipitous at the flower point. Then the cart slowly decreases steepness at the lollipop, then increases slant again and is most precipitous one more time at the face point. After the ride, he walked as if he left his brain on the cart where he enjoyed the coaster a while ago.


What does this ride have anything to do with functions?


Let us see.... Have you heard the terms maxima, minima, first derivative, second derivative, and the like? Well, you must be familiar with them. If not, let me take you to a review.


Review


Let me present you a table of summary of how to make use of derivatives in analyzing graphs of functions.


Let's try to put these things into application.


Example 1 : Scrutinize the function f given as f(x) = x3 – 3x + 2.


Let us find first the critical values (x-values for which f(x) is at the relative etrema). Using differentiation, we could find the first derivative of f, which would give us much details of critical values.


Critical values sets points on the graph of a function for which the relative extrema occurs. It is where tangent line is horizontal or has slope zero. Since the first derivative represents the slopes of all tangent lines on the graph, we could therefore say that the zeros of the first derivative gives us the critical values. Thus:


f(x) = x3 – 3x + 2.
f’(x) = 3x2 - 3
equating f'(x) to zero, we have
0 = 3x2 - 3
3x= 3
 x= 1
x = ±1

So we have two critical values 1 and -1. We don't know which exist on either the relative maxima or relative minima of the function.

If the first derivative is concerned of all the slope of the tangent lines on the graph of a function, the second derivative focuses on the rate with which the slopes of these tangent line changes throughout the domain of the function. So the second derivative would tell us much on the location of corresponding critical points to the critical values we have. So:


f(x) = x3 – 3x + 2.
f’(x) = 3x2 - 3

f"(x) = 6x
letting f"(1), we have
f"(x) = 6

That is, a positive rate of slope change, (decreasing to increasing), on which graph is concave upward, and critical point is minima.

letting f"(-1), we have
f"(x) = -6

That is, a negative rate of slope change, (increasing to decreasing), on which graph is concave downward, and critical point is maxima.

We could summarize this on a table as follows:


Saturday, January 22, 2011

Calculus of One Variable: Area Under the Curve and The Definite Integral


Recap

Let us make some "mathematical experiments" and make inference with the data that we have gathered. But first, let us review ourselves with integration. What is Integration?

Integration or Antidifferentiation is where we get the antiderivative of a function by using the reverse of differentiation. To better understand this, suppose we have a function:

F(x) = 3x3 + 2x– 5x + 1
then the derivative of F(x), which is F'(x) is:

F’(x) = 3◦x3-1 + 2◦2◦x2-1 – 5◦1x1-1 +0
F’(x) = 3x2 + 4x1 – 5x0 
F’(x) = 3x2 + 4x – 5


Using differentiation, we obtained the derivative of F(x), that is F'(x), suppose we say that let A'(x) = F'(x), then how should we antidifferentiate it?

A’(x) = 3x2 + 4x1 – 5

let the resulting function be A(x), then:


all multiplications become divisions and all subtractions become additions. So, we have:

A(x) = x3 + 2x2 – 5x + C

where C there is an indefinite constant, also known as the constant of integration


We call A(x) as the integral of A'(x), where we have seen that antidifferentiation is the reverse of differentiation.

Therefore, by Leibniz notation, we could tell that:


where the symbol ⌠ is what we call the integral sign, F'(x) the integrand, F(x) the integral, and C the constant of integration.

So, that's it! We are done with the review. Are you ready with the "experiment"? :)


Area

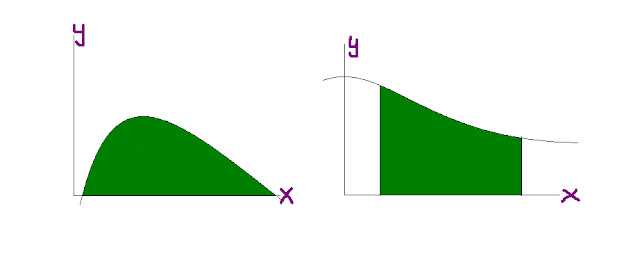
We wished to find the area between a function under it and the x-axis. How should we have it done?

Let us have first the simplest graph, the horizontal line graph represented by f(x)=m, where m is a constant. So, we would let the area between f and the x-axis defined over the interval [0,x]. That forms a rectangle that sits on the interval on x-axis. So:
The vertical line from the number x on the x-axis to the line graph above it has length m while the horizontal line from the origin to the number x on the x-axis has length x. Do you know why? Since we let the area of the rectangle formed, that green area over the interval [0,x], the horizontal lines will obtain the length x since those lines extend x-number of units from the point of origin. The vertical lines also extend m-number of units.

Since we have the length x and width m, we could compute for the area of the rectangle, or the area between the function f and the x-axis. That is given by:

A = Length x Width
A = mx

If we would let A be an area function A(x), and x be any number: that is, the x would not be a definite value anymore and will now vary, then:

A(x) = mx
This function A(x) is a graph of a line with y-intercept 0 and slope m. It's graph now would be something like this:
Now, let us consider the linear function f(x) = mx and the area between it and the x-axis over the interval [0,x]. This forms a triangle figure.
Likewise, the length of the vertical line is mx (since the line extends from the number x on the x-axis to the line graph with the function output mx)and the length of the base is x. Thus,:
A = one half of base times height

A = (1/2)(mx)(x)
A = (1/2) mx2
Now, we let x vary and have the area function:
A(x) = (1/2) mx2

The graph of A(x) somehow looks like this:
Now for the conjecture:
Let us tally first our data:

What have you observed? Isn't it that the area function A(x) is the Integral of the function f(x)? Now let us investigate the theorem:

Theorem:

"Let f be a positive continuous function on an interval [a,b] and let A(x) be the area of the region between the graph of f and the x-axis on the interval [a'x]. Then A(x) is a differentable function of x and
A'(x) = f(x)"
Proof:


Let that green area be A(x), so that its derivative is as follows:


Remember that A(x+h) is the total area (red and green) and A(x) is the green area. Now considering A(x+h) - A(x) gives us the area of the small portion (red). This small portion has the area approximately of that rectangle with base h (that is, the horizontal line at the bottom of the red area) and height f(x) (that is, the vertical line from the value x + h to the horizontal line of value f(x).Thus:
A(x+h) - A(x) = Area of the Small Portion
A(x+h) - A(x) = Area of a Rectangle (base x height)
A(x+h) - A(x) ≈ f(x)h
So that:


Now it is proven that A'(x) = f(x). Going back to the theorem, we could then say that the area function of any continuous function is the antiderivative, or integral of that function. We also conclude that the area function and any antiderivative of the function differs by a constant. Now, let us have some sample exercises:

Exercises 1: Find the area under the graph of y = x2  on the interval [-3,2].

First, we must define C. To do that, we accept the fact that there is NO area above the x-value -3, or A(-3) = 0, so that if:

f(x) = x2
A(x) = X3/3 + C
so:
A(-3) = (-3)3/3 + C

0 = -27/3 + C
C = 9

Now, we have the value of C. This would set the area from x=-3. The next thing is to use the same area function with the new constant value to x=2. Thus:
A(x) = X3/3 + 9
A(2) = (2)3/3 + 9
A(2) = 35/3

* The Area between the graph of f and the x-axis on the interval [-3,2] is 35/3.

The Definite Integral

We have the theorem about antidifferentiation. It states that:

"If two functions F and G have the same derivative on an interval, then
F(x) = G(x) + C"

This shows that if F and G have the same derivative on an interval, say f, then the two must differ by a constant. What if we defined the interval as [a,b]? If they differ by a constant, then:

If: F(x) = G(x) + C, then

F(b) - F(a) = [G(b) + C] - [G(a) + C]
= G(b) - G(a) + C - C

F(b) - F(a) = G(b) - G(a)

Therefore we could say that the difference F(b) - F(a) is equal to all antiderivatives of f. This difference is defined as the definite integral of f from a to b.Thus:
Where F is any antiderivative of f.

Let us make use of them!

Example 2: Integrate 
Using the antiderivative X3/3 + x, we have:

=(4 )3/3 + 4 - [(3)3/3 + 3]

=40/3

Please note that on a given interval [a,b], since a<b, then b, the larger one is on the top of the notation.

This becomes more exciting if you discover something other than that. For once, let us look at a given situation:

Let A(x) be the area of the region on the interval [0,x], then A'(x) = f(x), this means that A(x) is an antiderivative of f. Is that so? Then we could say that the difference A(b) - A(a) is the same for all antiderivatives of f.Thus, we could say in terms of definite integral that:
Now, isn't it that A(b) - A(a) is the area over [0,b] minus the area over [0,a], which is the area over [a,b]?

By definition, therefore, we say that if we:

"Let f be a positive continuous function over closed interval [a,b]. The area under the graph of f on the interval [a,b] is
"

How about doing similar exercise?

Exercise 3: Find the area under the graph of y = x2  on the interval [-3,2].

Now, we use the definite integral, so that:


* So the area under the graph on the interval [-3,2] is 35/3 square units.

EFY, Krizelle Rubi B. Deza

Works Cited:

Bittinger, Marvin L. and Morrel, Bernard B. Applied Calculus.Canada: Addison-Wesley Publishing Company, Inc., 1984.

Saturday, January 8, 2011

Makroekonomiks: Pagkompyut sa Buwis

Kung gusto mong malaman ang buwis na kinakaltas sa 'yo kada kinsenas, kailangang masagot ng "oo" ang sumusunod:
  • Alam mo ba ang kita mo kada taon (o yung tinatawag na annual income)?
  • Alam mo ba kung may asawa ka ba (married) o iilan ang anak mo o umaasa sa 'yo (number of dependents) o kung puno ka ng pamilya(head of the family)?
  • Alam mo ba kung ilang araw ng pasahod (paydays) kayo meron?
Para mas maunawaan ang aking sinasabi, tignan ang sitwasyon sa ibaba:

Si Sugar Ongcoy ay may asawa at dalawang anak. Siya ay nagtatrabaho sa isang kumpanya bilang isang empleyado at may sweldo siyang P 5,000 kada kinsenas (every 15th day). Magkano ang binabayarang buwis ni Sugar kada araw ng pasahod (payday)?


Solusyon:

Unang-una, kailangan natin malaman ang tax exemption ni Sugar. Ayon sa sinabi, siya ay may asawa at may dalawang anak. Ibig sabihin ay Married siya at may dalawang Dependents siya, so bale, kung titignan sa talahanayan:


Ayon sa New Tax Law:

P50 000  + 2(P25 000) = P 100 000
may asawa + may dalawang anak = exemption

Alam na natin ang exemption kaya ibawas natin sa kabuuang kita niya:

Kabuuang Kita (KK) = Sweldo kada kinsenas x Bilang ng Paydays
KK = P 5 000 x 24
KK= P 120 000

Ang depinisyon ng Tax Exemption ay nagsasabi na ito ang tagapagbawas ng buwis na ikukubra sa 'yo, so bale:

Taxable Income (TI) = KK-Exemption
TI = P 120 000 - P 100 000
TI= P 20 000

At yan ang taxable kay Sugar. Ngayon, tignan natin ang Tax Table:


Ano ulit yung taxable income (TI)? Diba P 20 000. So saang range siya nahuhulog?

Pumasok siya sa Range na Higit P 10 000 pero hindi hihigit sa P 30 000, kaya ang pormula na gagamitin (kung titignan sa Tax Table) ay:

Annual Tax = P 500 + 10 % of excess over P 10 000
Ano ung excess over P 10 000???

Ang excess over P 10 000 ay ang diperensiya ng iyong Taxable Income (TI) sa pinakamababang halaga sa range na pinasukan ng kita mo (sa atin na kung sa range na P 10 000 - P 30 000 ay yung P 10 000). So bale:

Excess (E) = TI - lowest range value
E = P 20 000 - P 10 000
E = P 10 000 <--- eto ang excess

Gagamitin ang excess sa pagkompyut ng taunang buwis ni Sugar. So bale:

balik sa range pormula ---> Annual Tax = P 500 + 10 % of excess over P 10 000
Annual Tax = P 500 + 10 % (P 10 000)
= P 500 + 0.10 (P 10 000)
= P 500 + P 1 000
Annual Tax = P 1 500

Ayan! Nakuha na natin ang taunang buwis na dapat bayaran ni Sugar. Ngayon ang tanong ay: Magkano ang binabayarang buwis ni Sugar kada araw ng pasahod (payday)?

Madali lang. I-divide mo lang sa bilang ng araw ng pasahod o payday meron si Sugar; so bale:

Tax every Payday = Annual Tax / No. of Paydays
= P 1 500 / 24
Tax every Payday =  P 62.50

Ayun ulet! Tapos na! So masasabi na:

Si Sugar ay nagbabayad ng P 62.50 na halaga ng buwis kada araw ng pasahod (payday) pwera ang iba pang kaltas tulad ng insurance, healthcare systems, atbp.

Naintindihan mo na ba?

Para di malimutan, heto ang buod ng pagkompyut:

  1. Alamin ang anwal na kita o kada kinsenas na kita ng tao, bilang ng mga araw ng pagpapasahod o payday, marital status niya, iilang umaasa sa tao, at kung ang tao ay head of the family ba o hinde.
  2. Tukuyin ang halaga ng tax exemption ng taong ito batay sa inpormasyong nakalap. Pagsama-samahin ang lahat ng exemptions na umaakma sa istatus ng taong ito. Gamitin ang Table 1: Tax Exemption.
  3. Bawasan ang anwal o taunang kita ng tao sa pinal exemption (lahat ng exemptions). Kunin ang diperensya. Ang diperensyang ito ang taxable income niya.
  4. Gamitin ang Table 2: Tax Table. Tukuyin ang range na pinasukan ng taxable income. Gamitin ang tumugmang pormula sa Table 2.
  5. Para kunin ang excess, tukuyin ang pinakamababang value ng range na natukoy. Tapos, kunin ang diperensya ng taxable income sa pinakamababang value na ito. Ang resulta ay ang excess.
  6. Gamitin na ang pormula. Gamitin ang excess value at ihalili sa pormula para makuha ang Taunang Buwis (annual tax). Ito na ang buwis.
  7. Kung gusto mo pan malaman ang buwis kada araw ng sweldo(payday), idivide lang ang annual tax sa bilang ng araw ng pasahod o payday.
Salamat sa sumusunod:
Hindi mabibigyan ng ganitong klaseng tulong ang mga kamag-aral ko ng di dahil sa inyo. Maraming Salamat!