Let me tell you a story of a little boy riding a crazy wavy coaster.
 From the start, at the peak, the boy started to move. He couldn't wait anymore. The cart started to move faster, and faster! and faster! The car slants and is most precipitous at the flower point. Then the cart slowly decreases steepness at the lollipop, then increases slant again and is most precipitous one more time at the face point. After the ride, he walked as if he left his brain on the cart where he enjoyed the coaster a while ago.
What does this ride have anything to do with functions?
Let us see.... Have you heard the terms maxima, minima, first derivative, second derivative, and the like? Well, you must be familiar with them. If not, let me take you to a review.
Review
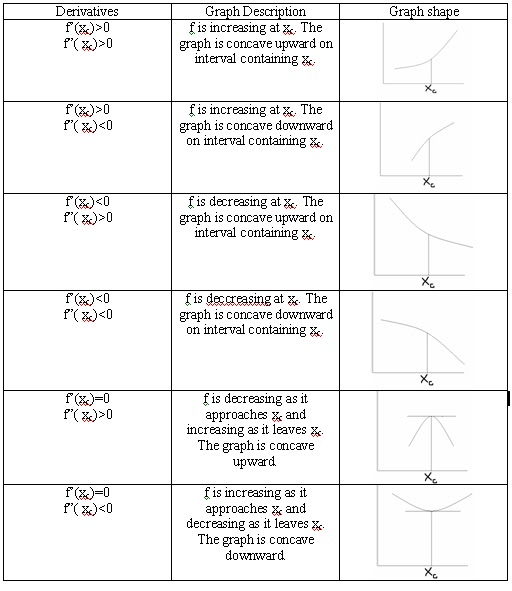
Let me present you a table of summary of how to make use of derivatives in analyzing graphs of functions.

Let's try to put these things into application.
Example 1 : Scrutinize the function f given as f(x) = x3 – 3x + 2.
Let us find first the critical values (x-values for which f(x) is at the relative etrema). Using differentiation, we could find the first derivative of f, which would give us much details of critical values.
Critical values sets points on the graph of a function for which the relative extrema occurs. It is where tangent line is horizontal or has slope zero. Since the first derivative represents the slopes of all tangent lines on the graph, we could therefore say that the zeros of the first derivative gives us the critical values. Thus:

What does this ride have anything to do with functions?
Let us see.... Have you heard the terms maxima, minima, first derivative, second derivative, and the like? Well, you must be familiar with them. If not, let me take you to a review.
Review
Let me present you a table of summary of how to make use of derivatives in analyzing graphs of functions.
Example 1 : Scrutinize the function f given as f(x) = x3 – 3x + 2.
Let us find first the critical values (x-values for which f(x) is at the relative etrema). Using differentiation, we could find the first derivative of f, which would give us much details of critical values.
Critical values sets points on the graph of a function for which the relative extrema occurs. It is where tangent line is horizontal or has slope zero. Since the first derivative represents the slopes of all tangent lines on the graph, we could therefore say that the zeros of the first derivative gives us the critical values. Thus:
f(x) = x3 – 3x + 2.
f’(x) = 3x2 - 3
equating f'(x) to zero, we have
0 = 3x2 - 3
3x2 = 3
x2 = 1
x = ±1
So we have two critical values 1 and -1. We don't know which exist on either the relative maxima or relative minima of the function.
If the first derivative is concerned of all the slope of the tangent lines on the graph of a function, the second derivative focuses on the rate with which the slopes of these tangent line changes throughout the domain of the function. So the second derivative would tell us much on the location of corresponding critical points to the critical values we have. So:
f(x) = x3 – 3x + 2.
f’(x) = 3x2 - 3
f"(x) = 6x
letting f"(1), we have
f"(x) = 6
That is, a positive rate of slope change, (decreasing to increasing), on which graph is concave upward, and critical point is minima.
letting f"(-1), we have
f"(x) = -6
That is, a negative rate of slope change, (increasing to decreasing), on which graph is concave downward, and critical point is maxima.
We could summarize this on a table as follows:


Love this! Thanks daen!
ReplyDeletethanks rence! :)
ReplyDelete